The poster “Licaminlimab in the treatment of dry eye disease,” highlighting data from the Oculis Phase 2b RELIEF trial, was presented by Anat Galor, MD, MSPH, during the ARVO 2025 Annual Meeting in Salt Lake City. The poster provides a look at the exploratory vehicle-controlled study assessing the effects of licaminlimab—a topically-administered single chain antibody fragment that neutralises the pro-inflammatory cytokine tumor necrosis factor α (TNFα)—in patients with signs of dry eye disease (DED), and the influence of a genetic marker, the CC genotype of single nucleotide polymorphism (SNP) rs1800693 in the TNFα receptor (TNFR1) gene.
The results of the study concluded that licaminlimab showed numerical differences to vehicle in changes from baseline in corneal fluorescein staining, with greater differences in patients with the CC genotype of the SNP rs1800693 in the TNFR1 gene. The study also concluded that identification of this genotype should allow targeting of treatment to patients who will derive most benefit in future trials with licaminlimab, and potentially permit a precision medicine approach to treatment for patients with severe DED.
Detailed Results From the Study
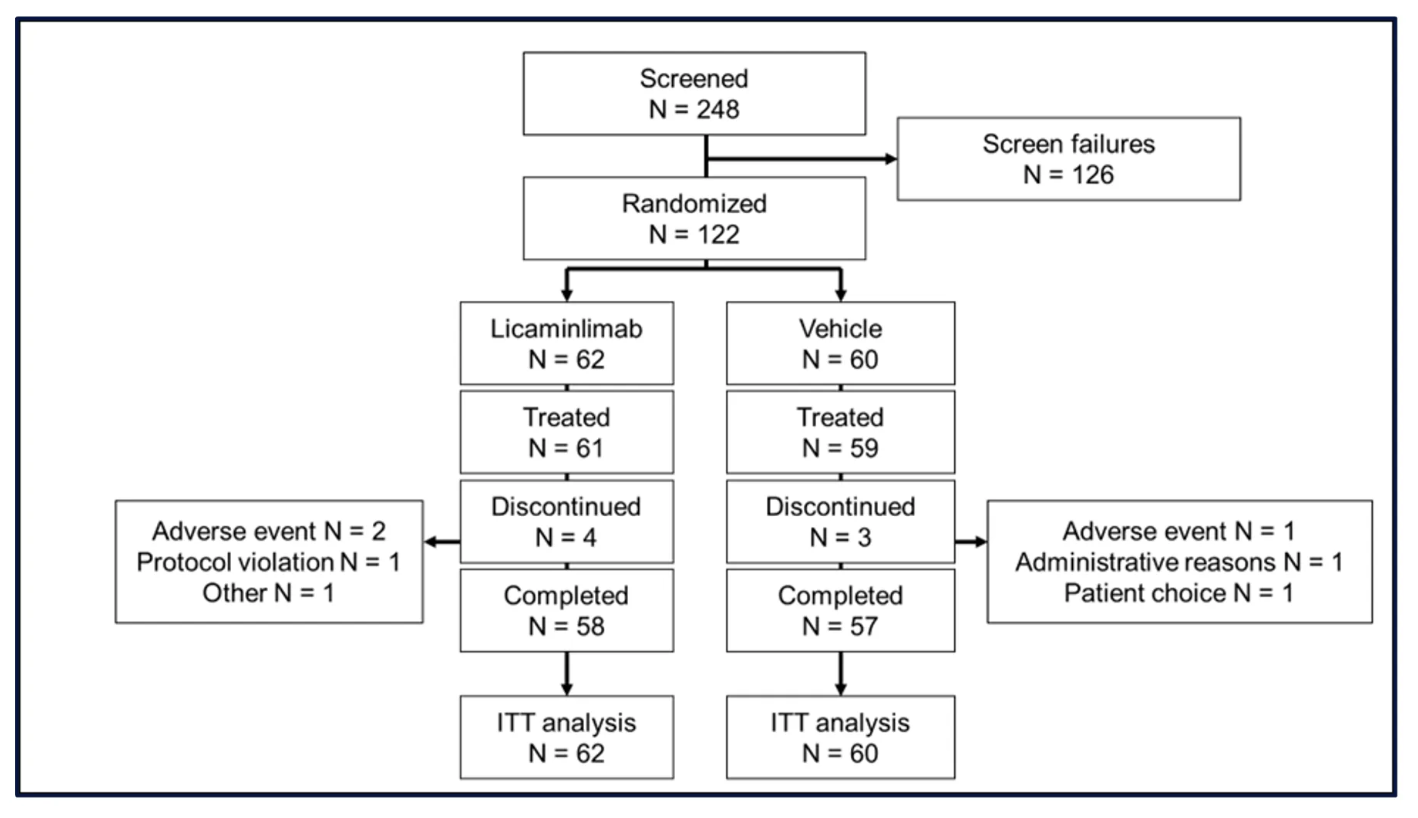
Sixty-two patients were randomized to licaminlimab and 60 to vehicle. Two patients, one in each group, did not receive treatment. Four patients (6.5%) in the licaminlimab group and 3 patients in the vehicle group (5.0%) discontinued treatment prematurely (Figure 1).
Baseline characteristics were comparable between treatment groups; 90% of patients were Caucasian and 72% were female, and 52% were ≥65 years of age. The CC genotype of SNP rs1800693 was present in 23/122 patients (19%). Baseline values for DED signs were well-balanced between treatment groups, for the Intent-to-Treat (ITT) population and for patients with the CC genotype of SNP rs1800693.
In addition, the licaminlimab group showed greater changes from baseline than the Vehicle group, for multiple endpoints. These included fluorescein staining in the inferior region and corneal sum, and unanesthetized Schirmer’s test.
The between-group difference in mean changes from baseline to Day 15 and Day 43 in pre- to post-CAE inferior corneal fluorescein staining are summarized for patients with the CC genotype of SNP rs1800693 in Figure 2.
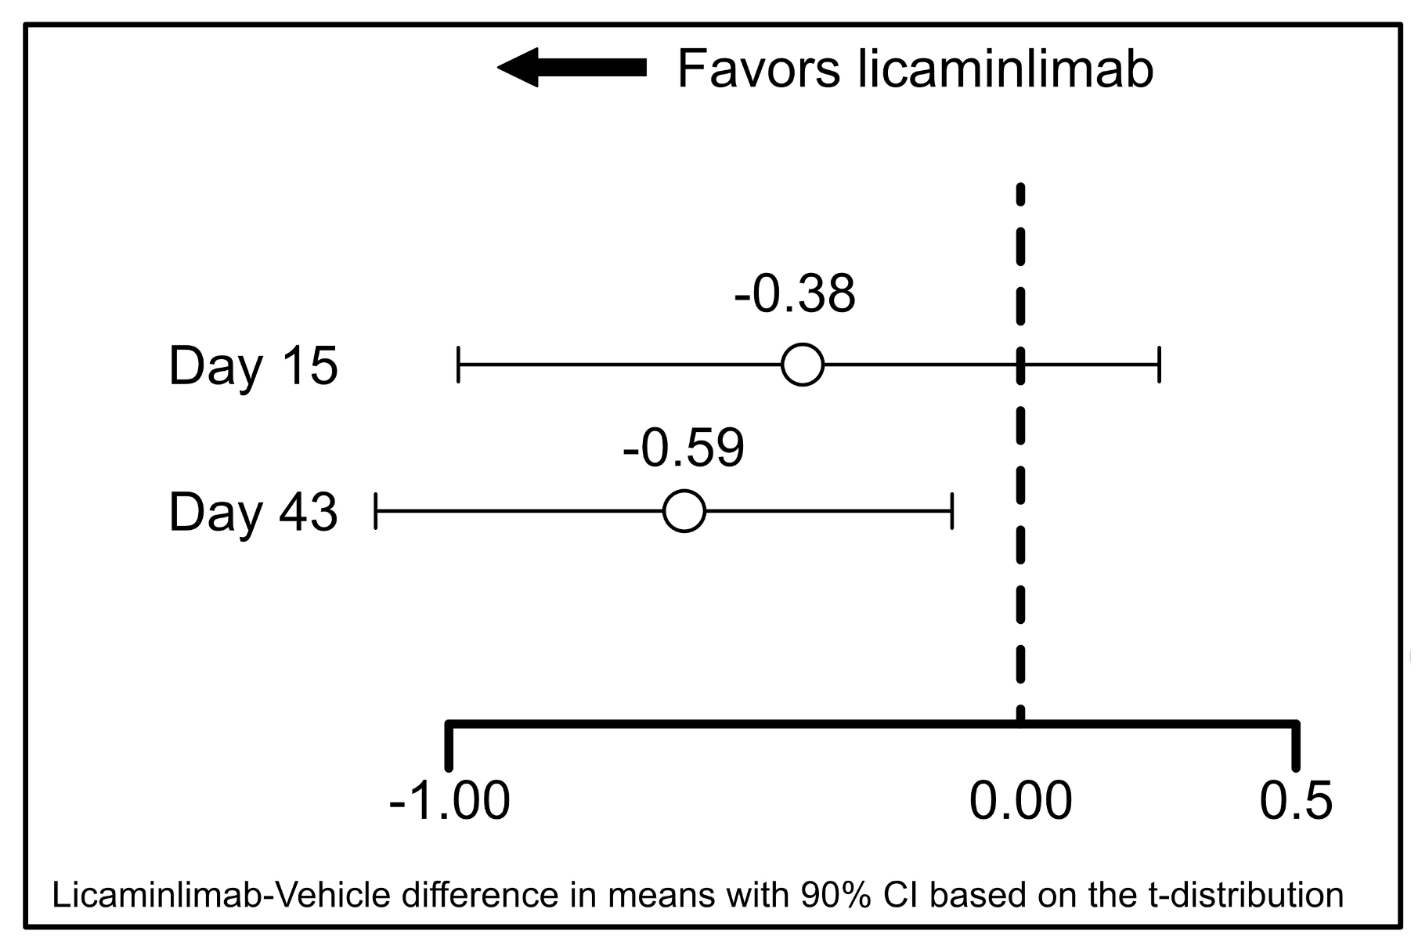
Figure 2 shows that numerical between-group differences were also apparent for the ITT population as a whole (at Day 43 the difference in mean changes was -0.12, 90% CI -0.378, 0.134), but these were smaller in than in patients with the rs1800693 CC genotype (-0.59, 90% CI -1.165, -0.017). This was also the case for fluorescein staining in other regions, particularly the nasal region, corneal sum, conjunctival sum and total sum.
The study also showed that licaminlimab treatment was well-tolerated. Ocular treatment emergent adverse events (TEAEs) in the study eye occurred in 13.1% of patients in the licaminlimab group and 10.2% in the vehicle group. The only TEAEs that were notably more frequent in the licaminlimab group were instillation site irritation (8.2% vs 1.7% in the vehicle group) and instillation site pruritus (3.3% vs 0, respectively). There were no serious ocular TEAEs in either treatment group, and all ocular TEAEs in the licaminlimab group were mild. Most ocular TEAEs in both groups were considered to be treatment related.
The study was conducted by Anat Galor, MD, MSPH, Eric Donnenfeld, MD, Christophe Baudouin, MD, PhD, Victor
L. Perez, MD, Preeya K. Gupta, MD, and Sabri Markabi, MD.
About the Study
Study Design
Randomization was stratified across treatment arms such that a minimum of 15% of patients had the TNFR1 rs1800693 CC genotype. After completing screening, patients received artificial tears for 2 weeks in a run-in period designed to identify patients who continued to show DED signs despite artificial tears. Patients were then treated with licaminlimab or vehicle for 6 weeks, with a 2-week follow-up phase. The Ora Controlled Adverse Environment (CAE), a room with a regulated environment, was used to exacerbate signs and symptoms in patients with DED.
Participants
Patients had to be ≥18 years old, with ≥6 months history of DED and of using wetting agents regularly for dry eye symptoms, and best-corrected visual acuity (BCVA) of at least 0.7 logMAR (Snellen 20/100) in each eye. Patients also had to have unanesthetized Schirmer’s Test score ≤10 mm and ≥1 mm in ≥1 eye, corneal fluorescein staining score (CSF) of ≥2 in ≥1 region in 1 eye and central corneal staining score ≥1 in the same eye, conjunctival redness score ≥1 in ≥1 eye pre-CAE, with in the same eye at least a ≥1 point increase in fluorescein staining in the inferior region in ≥1 eye following CAE exposure, and ≥1 eye, the same eye, satisfying all criteria for DED signs.
Assessments
The signs of DED were assessed at baseline, Day 15 and Day 43, as follows: fluorescein and lissamine green staining scores, both rated between 0 (none) and 4 (confluent); unanesthetized Schirmer’s test, prior to CAE exposure; conjunctival redness, pre- and post-CAE exposure, rated from 0 (none, normal, without vasodilation) to 4 (severe, broad ciliary and prominent, horizontal conjunctival vasodilation); lid margin redness, pre- and post-CAE exposure, rated from 0 (none: normal) to 4 (very severe: marked diffuse redness of both lid margin and skin); tear film break-up time, in seconds, measured pre- and post-CAE.
In addition, safety was assessed in terms of TEAEs, BCVA, slit lamp biomicroscopy, undilated funduscopy, intraocular pressure (IOP) and drop comfort.
Statistical Methods
Analyses of DED signs were undertaken using the ITT population (all randomized patients, analyzed based on the treatment to which they were randomized), and separately for patients with the rs1800693 CC genotype.
All statistical hypothesis tests were exploratory. Statistical tests were two-sided with a significance level of 0.05 (α=0.05). Confidence intervals (CI) for differences between treatment groups were two-sided at 95% confidence.
To further explore fluorescein staining, Schirmer’s test, and conjunctival redness, post-hoc analyses computing 90% CIs for differences in treatment group mean based on t distribution were performed. Similar analyses were performed for changes from baseline, with an additional comparison of treatment groups based on an analysis of covariance model with treatment group as a fixed effect and baseline value as a covariate.
Source: Ophthalmology Management